
Net Zero Banking Alliance: A Token-based Model#
Industry Perspective
Disclaimer: The views and opinions expressed in this article are solely those of the author
Key Insights
A token-based model marks a significant evolution in sustainable finance, effectively integrating environmental goals with banking operations, particularly in managing financed emissions.
Tokens quantify CO2 emissions, offering a precise and transparent method to track and manage emissions in banking activities, aligning financial practices with environmental targets.
This system allows for nuanced emissions management, supporting intertemporal and cross-industry compensation, and enhancing efforts to achieve Net Zero goals.
Utilising blockchain technology for CO2 tokens adds a layer of security and efficiency, fostering trust in the banking sector’s environmental commitments.
The model shifts focus from traditional metrics to the actual purpose of financing, ensuring a more accurate impact in reducing banking portfolios’ carbon footprint.
Despite its potential, the model’s implementation faces challenges such as stakeholder alignment, regulatory compliance, and balancing financial and environmental objectives, underscoring the need for ongoing adaptation in sustainable finance.
Introduction#
ESG, an acronym that stands for Environmental, Social, and Governance, represents a paradigm shift in how businesses, financial systems, and investors evaluate the impact of their activities. While the three pillars—environmental, social, and governance—reflect distinct dimensions, our spotlight falls distinctly on the environmental realm, echoing the growing urgency to address climate change and environmental sustainability.
Within the environmental spectrum, the concept of emissions is stratified into three critical scopes, each bearing a unique set of challenges and opportunities.
Scope 1 emissions encompass direct emissions from sources owned or controlled by the bank, which typically include internal combustion engines and on-site energy production. These emissions are directly measurable and quantifiable, forming the foundational layer of a bank’s carbon footprint.
Scope 2 emissions, on the other hand, entail indirect emissions associated with the electricity, heating, and cooling consumed by a bank. While not originating directly from the bank, Scope 2 emissions are nevertheless a consequence of the bank’s operations, highlighting the necessity to transition towards cleaner, renewable energy sources.
Scope 3 emissions broaden the horizon, encompassing a web of indirect emissions that result from a bank’s value chain. This includes emissions linked to the bank’s customers, suppliers, and the lifecycle of products and services. Thus, a bank’s Scope 3 emissions essentially comprise the Scope 1 and Scope 2 emissions of their customers. Consequently, it is common to refer to these as ‘financed emissions’ [nat23].
Furthermore, one of the most important metrics in the ESG world is CO2 Equivalent (CO2e) [eur23]. It quantifies emissions in terms of the amount of CO2 that would exert an equivalent warming effect over a specified period. Understanding CO2e is vital for assessing and mitigating environmental impact.
In this article, we aim to explore the links between the banking system and its financed emissions. The Net Zero Banking Alliance [une23] stands at the forefront of this exploration. This collaborative coalition of banks and financial institutions is dedicated to mitigating climate change. Its primary goal is to address ‘Scope 3’ emissions, which constitute the largest portion of a bank’s emissions. Banks participating in this initiative commit to reducing their CO2e footprint, particularly by focusing on their Scope 3 emissions. From the customers’ perspective, these are equivalent to Scope 1 and Scope 2 emissions, often termed ‘financed emissions.’ In addition to reducing emissions, these banks support sustainable initiatives. This alliance is crucial in reshaping the financial sector’s role in environmental conservation. Its goals include a 55% reduction in financed emissions by 2030 and, by 2050, balancing any remaining financed emissions with activities that remove an equivalent amount of greenhouse gases from the atmosphere, such as afforestation, reforestation, and carbon capture technologies [Uni23] [SA23].
For financial institutions, joining the Net Zero Banking Alliance is pivotal. It goes beyond just meeting regulatory requirements; it establishes credibility, fosters client trust, and attracts eco-conscious investors. Embracing sustainability, banks contribute to environmental protection and enhance their long-term viability and resilience against climate-related risks.
Additionally, being a pioneer in adopting the Net Zero approach proactively can provide a competitive edge in the growing arena of green assets. Contrary to the common misconception of a trade-off between emissions and profits, it is possible to cut this trade-off by highlighting the potential for simultaneous environmental stewardship and financial growth.
The aim of this science note is to argue that the current approach to the Net Zero methodology in banking is overly cautious and not as effective from an ESG optimisation perspective. In other words, it’s not fully efficient in reducing the carbon footprint of current bank portfolios.
Net Zero as-Is mechanics#
Current strategies and methodologies in the banking industry involve several key steps to integrate Net Zero principles:
Identifying Industry Perimeter: A bank should identify which industries want to consider its Net-Zero analysis. A bank can have a baseline for each industry analysed. Industry perimeters (e.g., Oil & Gas, Power, Steel, etc.) are identified based on NACE codes [Eur10] related to customers as present in Master Data information. This is one of the most significant pain points. The Net Zero methodology should be linked to the purpose of the financing, not the NACE code of the company. For example, general financing with no clear purpose should no longer be allowed. If a steel company has a loan for installing photovoltaic panels to generate renewable energy for its activities, this loan should not be included in the Net Zero baseline for the Steel industry. This represents a major data quality issue in banks. It’s crucial to start an initiative to map the real purpose of historical loans (i.e., stock) to avoid withdrawing credit lines from companies that are paradoxically implementing ESG strategies, as in the steel company example. According to the standard and as-is Net Zero approach, general financing towards steel (typically mapped with steel NACEs) should be avoided due to the carbon intensity emissions of the steel industry. However, financing for renewable energy, mapped with specific NACEs related to the specific purpose of financing and not to the industry, will highlight an ESG benefit derived from this financing. In conclusion, it is crucial to analyse these additional problems related to NACEs.
Consider that banks’ Master Data databases typically assign a single NACE to holding companies or heterogeneous groups. For Holding Companies, a generic NACE is inserted. From a climate and net-zero perspective, this generic holding NACE is not useful. Take, for example, a large Oil & Gas group, comprising a holding and various operating companies. The holding company often manages financial activities for the operating companies, leveraging its bargaining power with banks for better interest rates. The funds from banks are, as expected, used not for holding activities but for the operating companies’ activities, which relate to the oil & gas industry. For a consistent Net-Zero methodology, it is crucial to consider the real NACE underlying this group, which is the Oil & Gas NACE, not the Holding one.
In the case of heterogeneous Groups, like Amazon, which spans e-commerce, IT and cloud services, gaming, etc., banks usually map in their Master Data the so-called main NACE, often based on a turnover analysis. This main NACE is linked to the department/product/function generating the most turnover. While this is a quick solution for Master Data issues, from a climate and net zero methodology standpoint, if a heterogeneous group has diverse ESG profiles (e.g., e-commerce and servers have different climate anf environmental profiles due to servers’ higher water usage compared to e-commerce activities, and e-commerce activities producing more CO2 Scope 1 due to trucks delivering goods), it becomes important to re-classify this group according to its legal entities. This re-classification helps in understanding how many ESG profiles exist and which entity truly needs a net-zero commitment and action plan.
Credit features: lifecycle or status: Credit features, particularly the lifecycle or status of a credit, significantly impact the baselines for financed emissions. Emissions are linked to financed companies, and the characteristics of granted credit play a crucial role in the construction of these baselines. For example, a 30-year credit with 5 years remaining requires the bank to assess its strategic value in the portfolio, impacting whether it’s renewed or not. Once such a credit expires, its associated financed emissions are removed from the Net Zero metrics, improving the bank’s carbon footprint. This is especially true when credits are at zero residual maturity. Additionally, the credit status, reflecting the borrower’s creditworthiness, is a key factor. Credits in good standing that turn non-performing (due to repayment issues) can paradoxically improve Net Zero values. Non-performing credits, often linked to operationally troubled companies, imply reduced emissions. When offloaded by the bank, these credits no longer affect its net-zero metrics. However, including non-performing exposures (NPEs) in baselines without adjustment can lead to inflated baselines and significant apparent reductions in carbon footprints in subsequent years, a form of greenwashing. Therefore, it’s best practice to exclude loans with less than a year of residual maturity and to be cautious about including NPEs in baselines to avoid artificially inflated metrics and misleading progress towards Net Zero targets.
Common Metrics Towards Various Industries in Net Zero Baseline: Establishing common metrics for various industries is essential in the Net Zero baseline.
Calculating EVIC for Each Customer: EVIC, or Enterprise Value Including Cash, is calculated as the sum of the ordinary shares’ market capitalisation at the fiscal year-end, the market capitalization of preferred shares at the fiscal year-end, and the book values of total debt and minority interests [Man22]. The current calculation methodology involves determining the proportion of a company’s EVIC that is attributable to a specific bank.
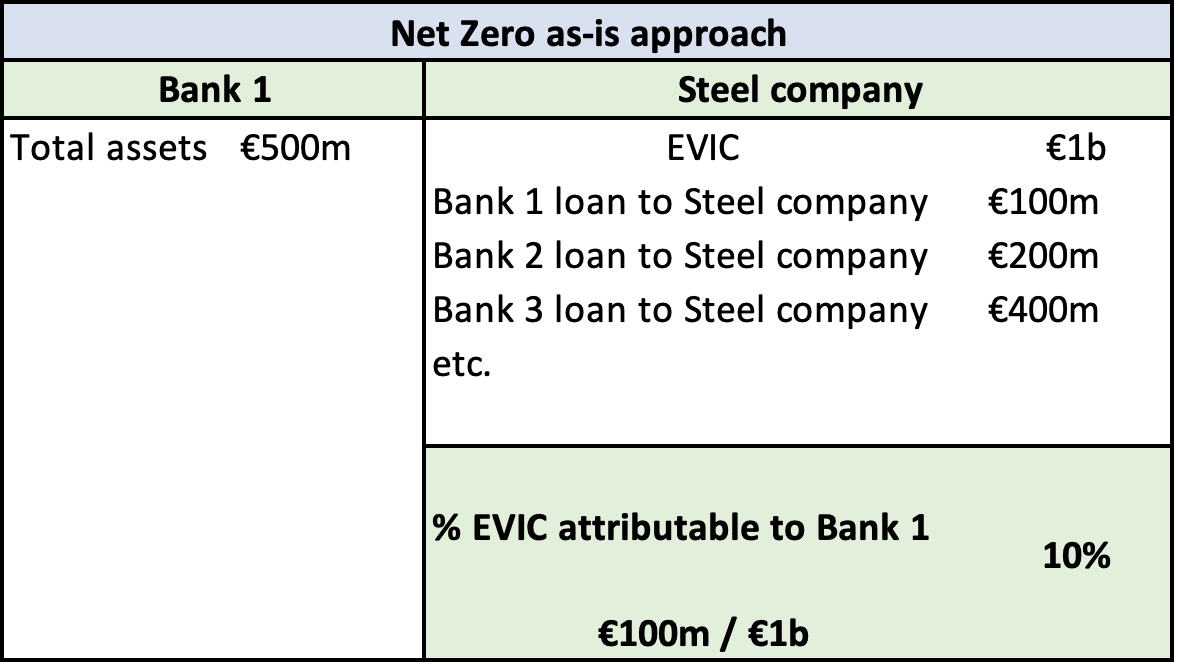
For example, let’s consider a steel company with a €1 billion EVIC, financed by several banks. If Bank 1 has extended a loan of €100 million to this company, it means Bank 1 holds 10% of the steel company’s EVIC. According to the Net Zero methodology, 10% of the steel company’s emissions (Scope 1 and Scope 2) are then attributable to Bank 1’s financed emissions (Scope 3), and this 10% contributes to Bank 1’s Net Zero emissions baseline.
However, this is another point of contention. For a bank joining the Net Zero Banking Alliance, it’s more relevant to consider the proportion of the loan granted to the steel company in relation to the bank’s balance sheet, rather than the other way around. This requires a paradigm shift in the calculation approach. The table below illustrates this concept.
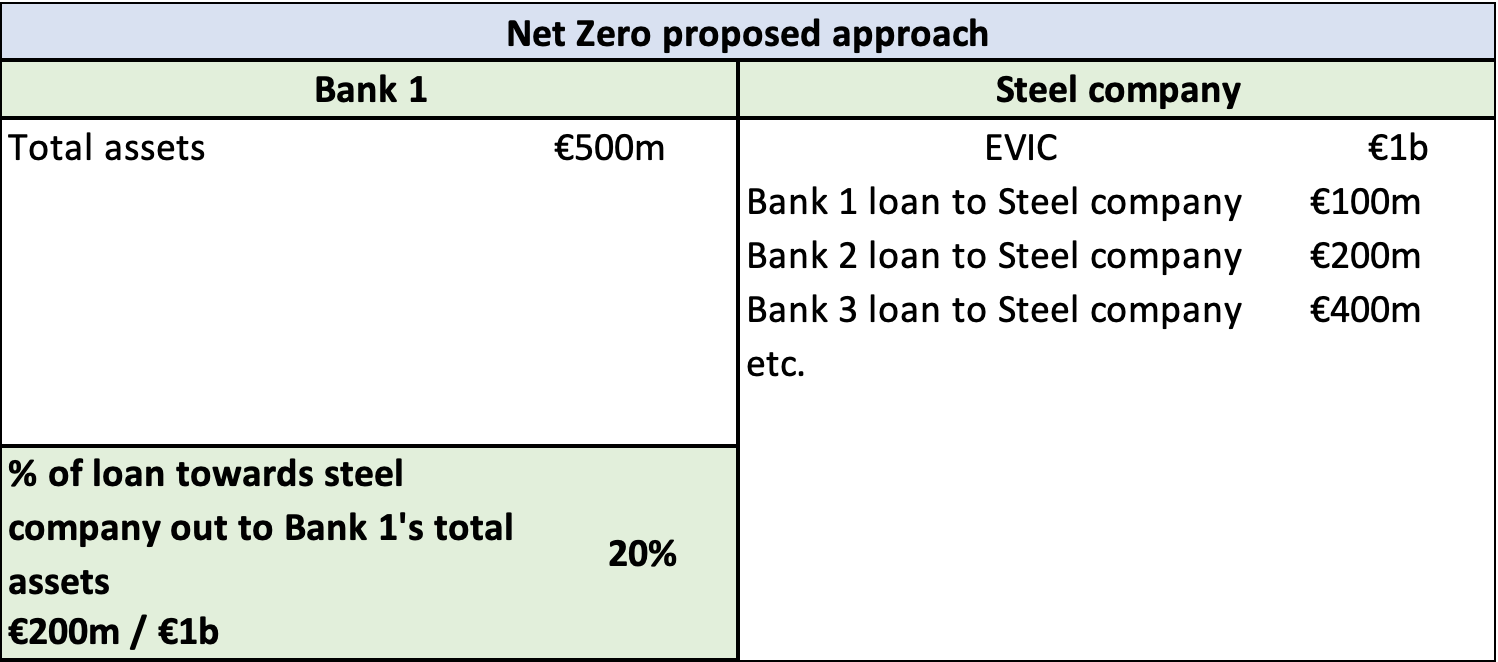
As demonstrated in this example, and comparing the two tables, the accurate ratio to consider should be 20%, not 10%. This 20% represents the portion of the steel company’s emissions that should be attributable to Bank 1’s Net Zero baseline.
This paradigm shift enables the consideration of the coefficient of transformation of brown assets into green assets, which serves as a proxy for a bank’s ability to transition from a high-carbon to a low-carbon economy. Consider the following example:
A small bank with a balance sheet of €10 million, where its only asset is a €10 million loan to a carbon-emitting company.
A large bank with a balance sheet of €10 billion that lends €1 billion to the same carbon-emitting company, despite the large bank having 100 times the amount of EVIC (Economically Viable Investment Capital) compared to the small bank.
Which bank is environmentally better? The small bank, with no margin or time to transition from brown assets (the €10 million loan to the carbon-emitting company), finds itself stuck. The loan is already granted and cannot be withdrawn, given its medium to long-term nature. Therefore, its coefficient of transformation of brown assets into green assets is zero, as it cannot invest in green assets. Financially, it isn’t viable to sell the entire credit to another institution due to the necessity of accepting a high discount rate, which could lead to financial troubles due to its lack of bargaining power.
In contrast, the large bank has €9 billion available to invest in green assets, as brown assets constitute only 1/10th of its total assets (€1 billion). This significant sum allows the bank to consider divesting from the €1 billion by selling the credit to another financial institution without encountering financial difficulties.
So, paradoxically, from an environmental standpoint (considering a bank’s transition capability from a high-carbon to a low-carbon economy), the large bank is more advantageous than the small bank, having both the means and the capital to invest in green assets.
Returning to our data tables, please consider this example:
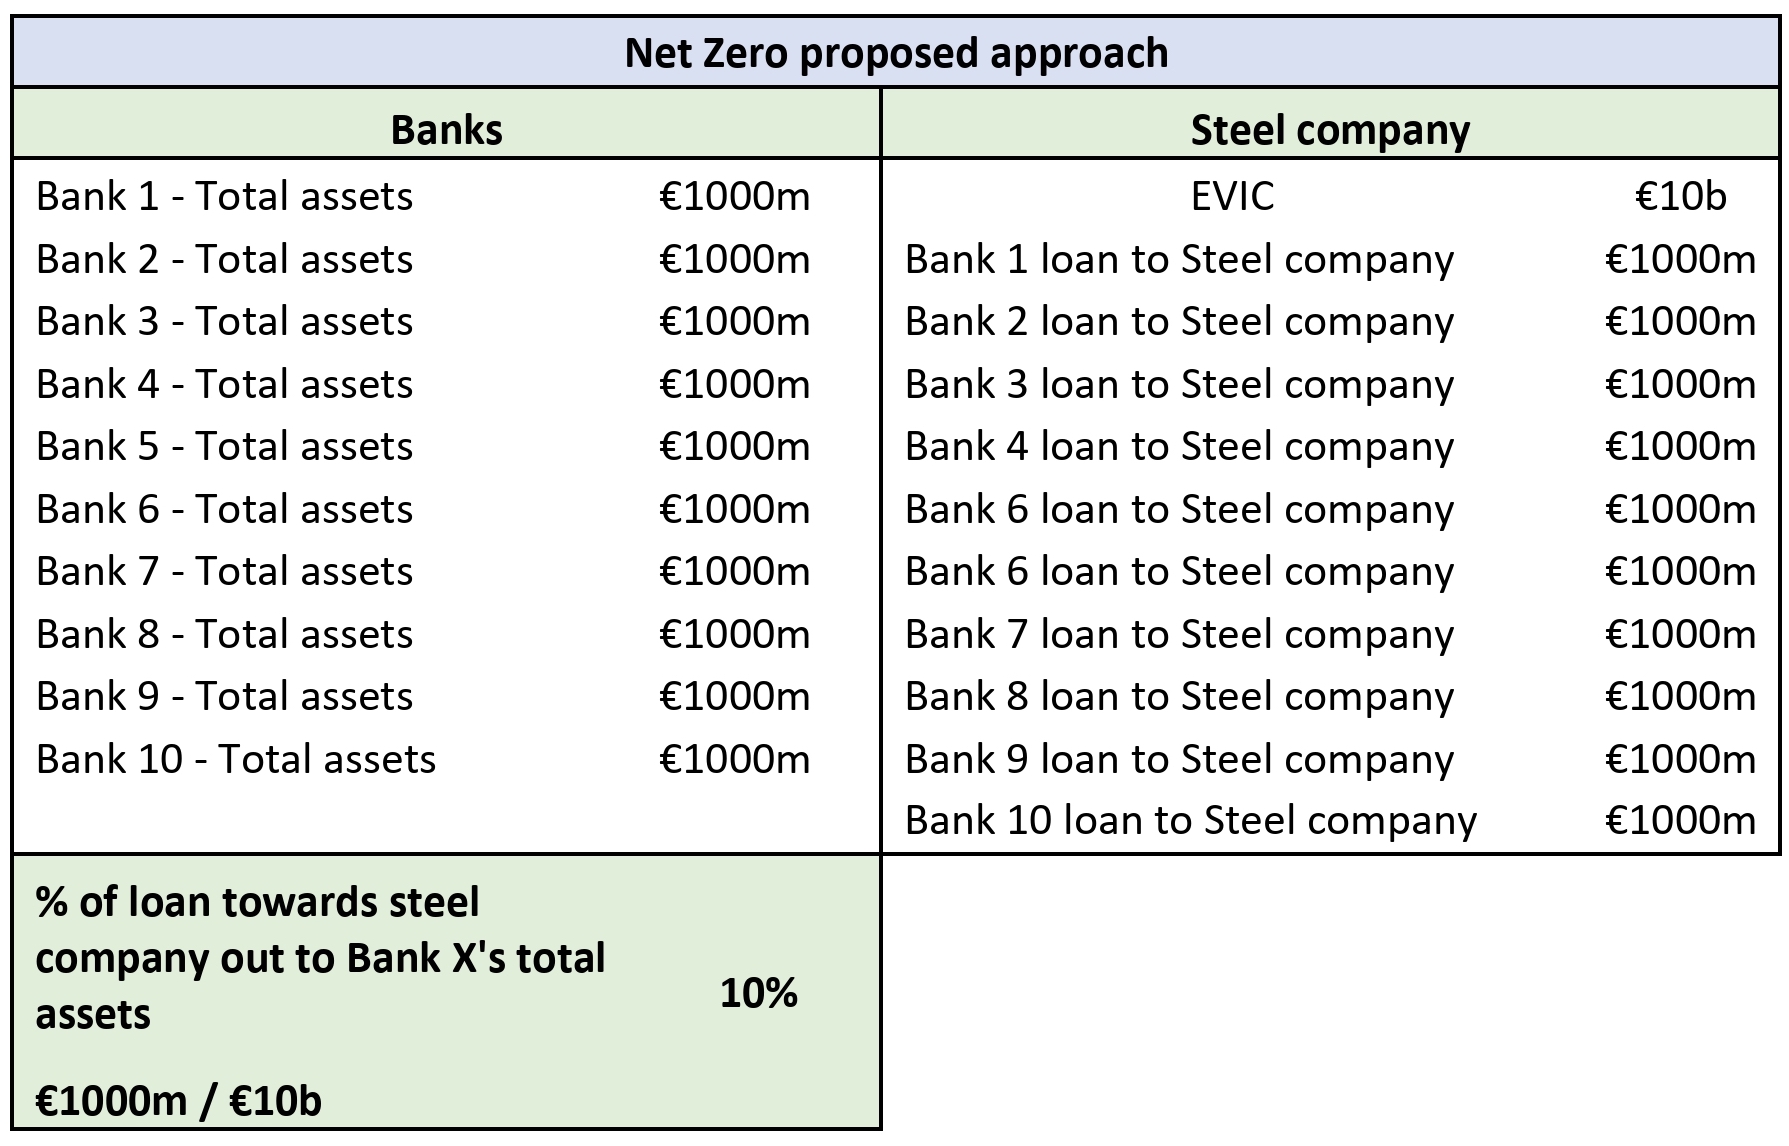
As you can see, no double-counting mechanism is in place.
Setting Baseline Years and Targets: Financial institutions establish baseline perimeter criteria and specific emission reduction targets for high-emission industries, including cement, aviation, automotive, oil & gas, and the power sector. Each perimeter comprises a list of companies operating in one of these industries that meet certain pre-determined criteria, serving as the starting point for evaluating environmental impact. Criteria examples may include the exclusion of non-performing exposures, mid-caps, high-capitalisation companies, and certain low-emitting industries, among others.
Monitoring at Company and Portfolio Levels: Banks meticulously monitor emissions data at both the company and portfolio levels, with detailed expectations for emission reduction. Actual emission values are compared against expected detailed GHG values during the Net Zero time horizon (2030 and 2050), facilitating a comprehensive analysis of the environmental impact [SA22].
Plethora of Metrics: The metrics used within banks and industries, especially in the Oil & Gas sector, are not uniform. For example, Credit Agricole’s Net Zero Oil & Gas targets [SA23] include ‘Scope 1&2 of all counterparts and Scope 3 of upstream players, based on our on-balance sheet exposure.’ In contrast, UniCredit’s Net Zero Oil & Gas targets [Uni22a] consider only ‘Scope 3, Category 11’ [Uni22b]. This example illustrates how targets vary depending on the metrics used. The Net Zero Banking Alliance should ensure a top-down approach that is equal for all market players.
Integration of Net Zero in Credit Origination Processes: It is essential to integrate Net Zero principles into credit origination processes. Each potential counterpart is evaluated from a Net Zero perspective, including determining if the counterpart falls within the baseline perimeter. If it does, the next step is to assess whether the counterpart adheres to the expected reduction plan outlined in Net Zero documents. If the criteria are met, the credit process proceeds; if not, additional documentation and commitments are requested. In some cases, if the criteria are not met, the credit may not be approved, ensuring support only for environmentally responsible businesses.
This meticulous approach should ensure that banks not only adhere to their own sustainability goals but also contribute significantly to the global effort of reducing carbon emissions. By embedding Net Zero principles into their credit evaluation processes, financial institutions play a vital role in promoting environmentally conscious business practices and fostering a greener, more sustainable future.
Net Zero proposed approach#
As discussed in the previous section, the current Net Zero approach has several weaknesses, primarily related to the NACE-industry related approach, the plethora of metrics, and the EVIC approach. Additionally, a revised approach should consider the following aspects:
The need for a more dynamic model: The current model is predominantly mathematical and requires modification to account for the financial and economic dynamics of banks and their customers’ transition plans. The current baselines might be overly penalising, particularly for customers with high transition risks, potentially depriving them of the opportunity to set up effective transition plans to reduce their emissions.
Incorporating mechanisms for compensation: The existing model links the granting of credit to a company’s emissions but fails to include mechanisms for compensation:
Between different companies.
Within the same bank’s portfolio.
Across various industries that constitute the bank’s exposure.
In our view, the challenge lies in mismatched metrics and the unexploited CO2e potential. For instance, when companies exceed their emission reduction targets, there remains an unutilised CO2e capacity. This presents an opportunity for financing other businesses, both in general financing and specialised financing domains.
By addressing these issues, the proposed approach aims to create a more balanced and effective strategy for implementing Net Zero principles in the banking sector. This would allow for a more nuanced assessment of companies’ emissions and better support the transition towards lower carbon outputs across different industries [San23].
Scenario 1#
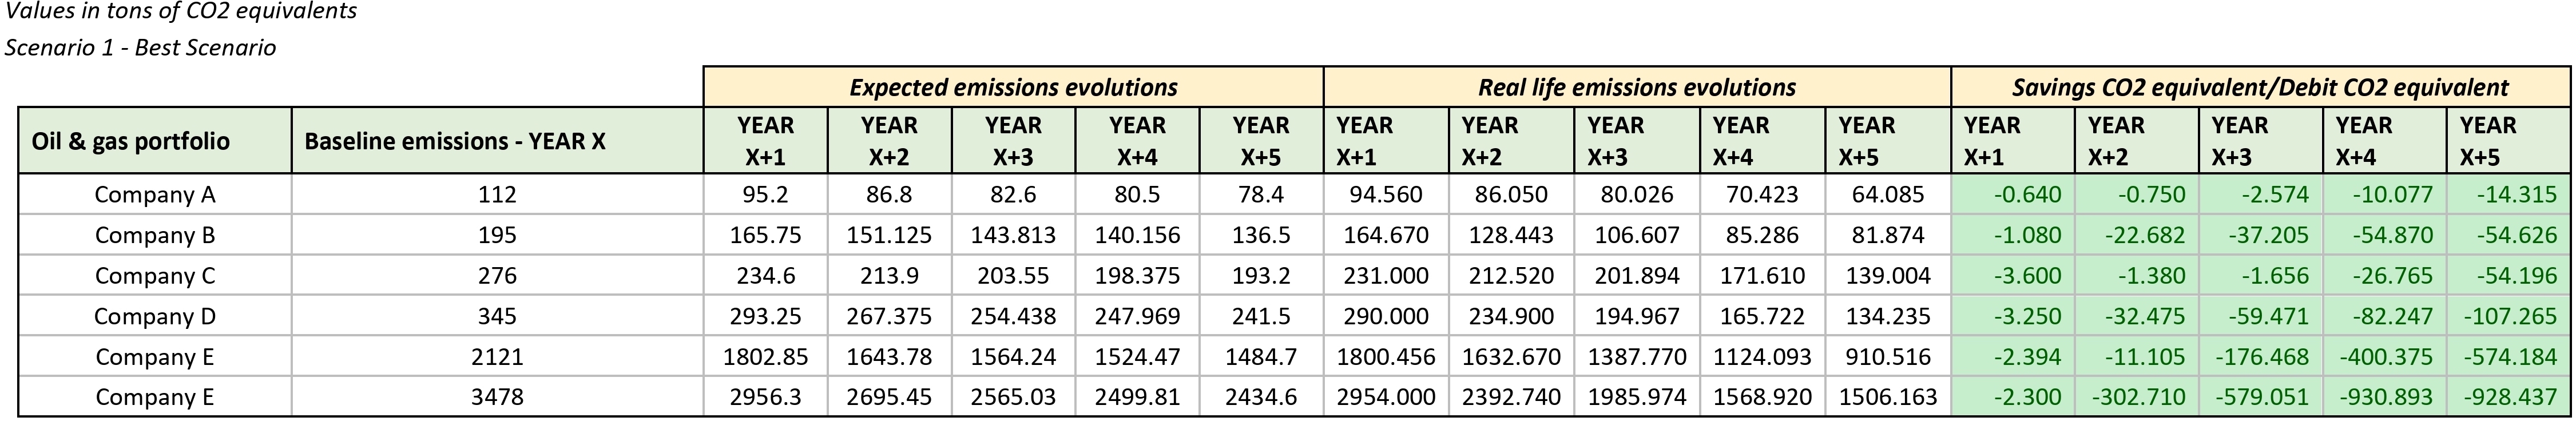
This scenario represents the best-case outcome: assuming a target for reducing emissions by 30%, all companies in our example successfully meet this target. Consequently, no CO2 equivalent compensation within the portfolio is necessary.

As demonstrated in the data, this portfolio achieves a total savings of 4,479,042 tons of CO2 equivalent. These savings can be transferred from this portfolio to other portfolios that are not generating savings but are accruing CO2 equivalent debits.
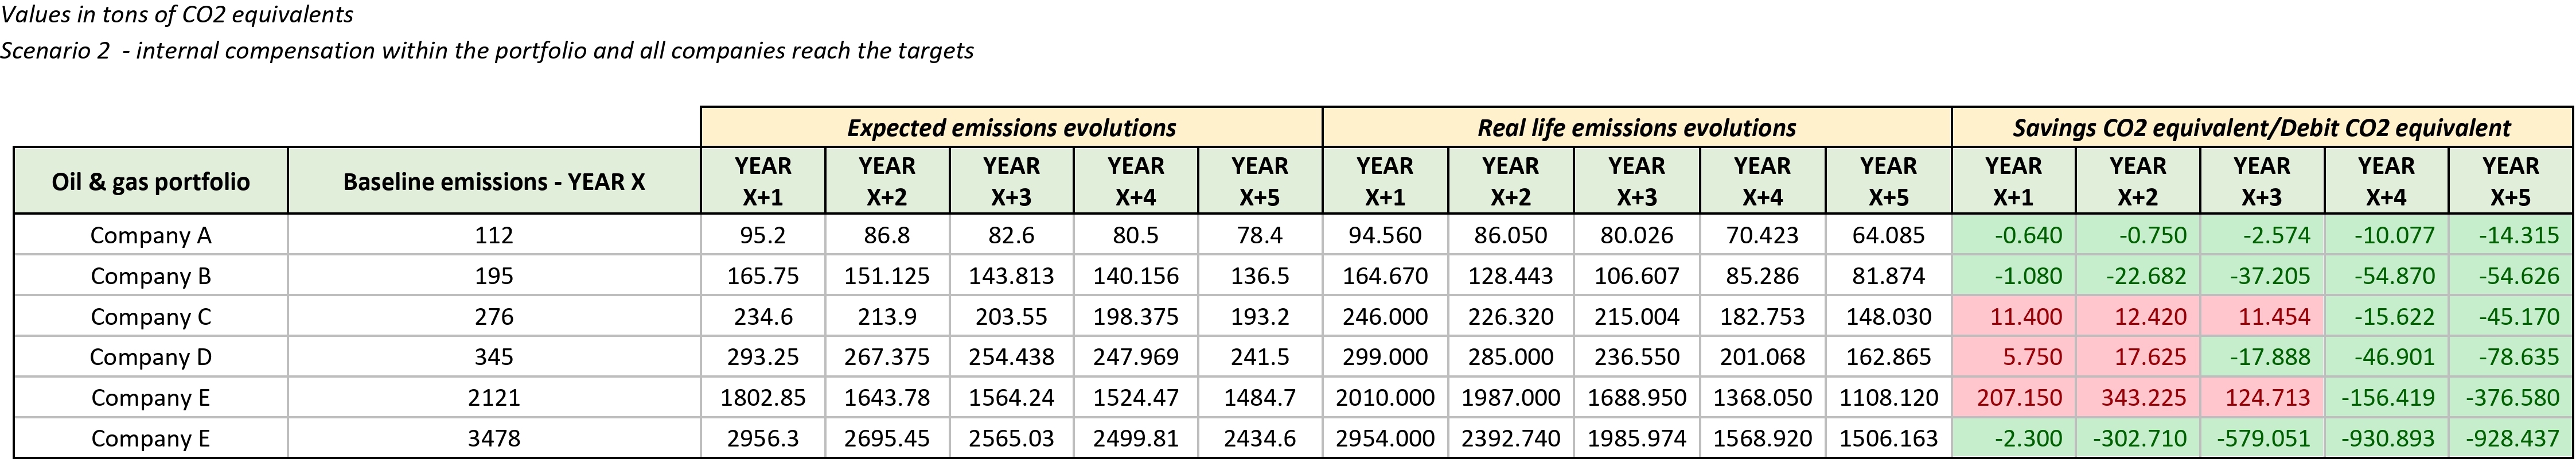
Scenario 2#
In this scenario, as illustrated in the data below, the portfolio generates a CO2 equivalent debit in years X+1 and X+2. Faced with this situation, the top managers of the Oil & Gas portfolio have a couple of options, according to the proposed model:
Compensate for the debit by requesting an equivalent amount of CO2 equivalent savings from other portfolios. This approach relies on the inter-portfolio exchange of CO2 credits to balance emissions.
If they have confidence in the credibility of their customers’ transition plans, they can opt to wait for intertemporal compensation within their own Oil & Gas portfolio.
For instance, examining the table provided, it’s evident that all companies within the portfolio eventually reach the target reduction of 30%. The previous CO2 debits (related to years X+1 and X+2) are successfully compensated in subsequent years X+3, X+4, and X+5.

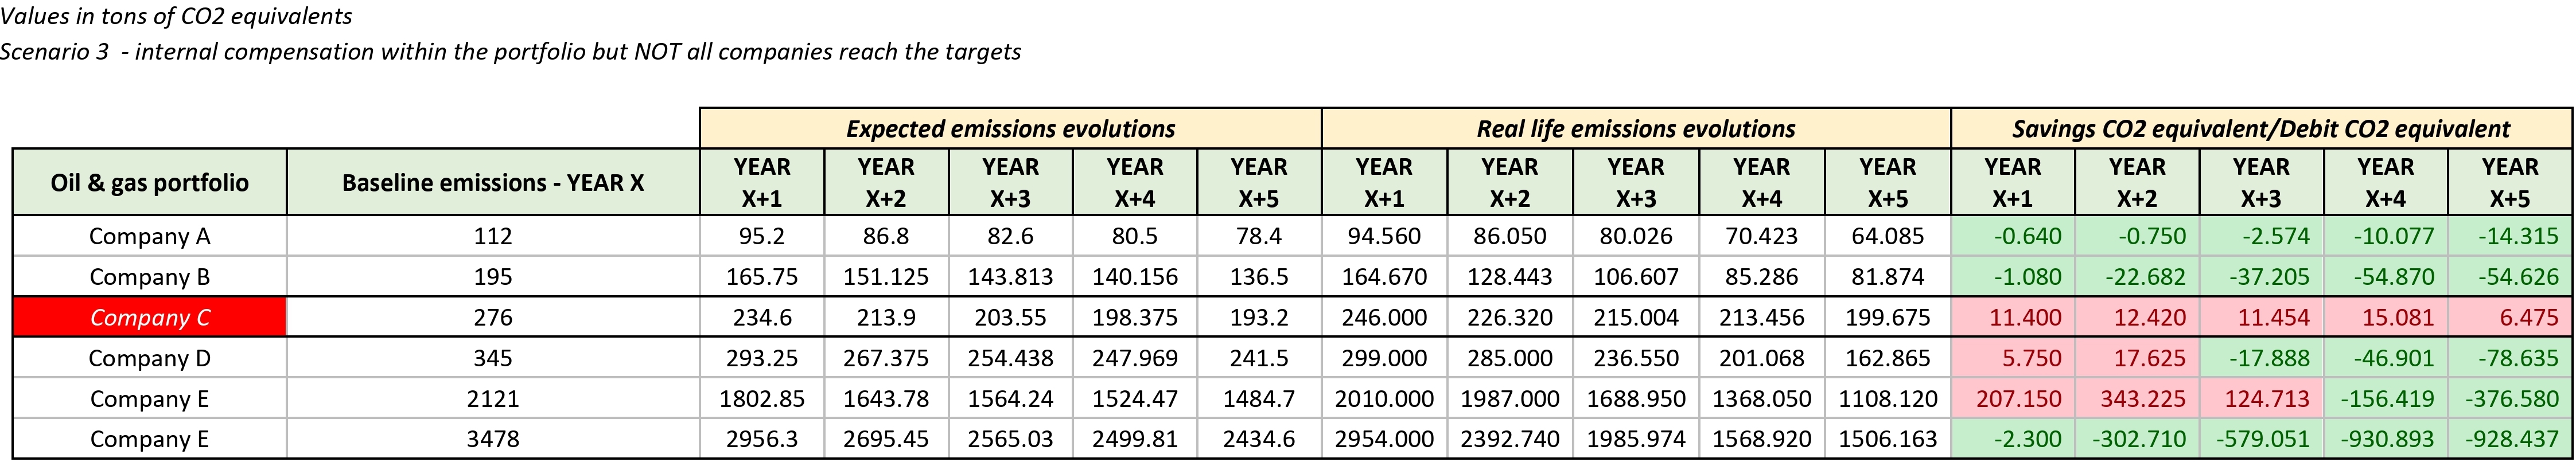
Scenario 3#
In this scenario, as shown in the data below, the portfolio generates a CO2 equivalent debit in years X+1 and X+2. The top managers of the Oil & Gas portfolio, following the proposed model, have several options:
They can compensate for the debit by requesting an equivalent amount of CO2 equivalent savings from other portfolios, effectively balancing emissions through inter-portfolio exchanges.
If they trust the credibility of their customers’ transition plans, they can opt for intertemporal compensation within their own Oil & Gas portfolio.
However, in contrast to Scenario 2, not all companies within this portfolio achieve the target reduction of 30%. Therefore, according to our model, the previous CO2 debits (related to years X+1 and X+2) are only partially compensated in years X+3, X+4, and X+5.
Additionally, for a company like Company C, which does not meet the target, the top managers face a strategic decision. If Company C is significant for the bank’s income statement and balance sheet, they might decide to retain it in the portfolio. Conversely, if Company C is not strategically important from an economic and financial perspective, a run-off strategy may be implemented, or a deeper analysis of the new transition plan could be considered.
This scenario highlights the challenges and strategic decisions involved in managing a portfolio with varying levels of emission reductions and underscores the importance of aligning environmental goals with financial and economic considerations.

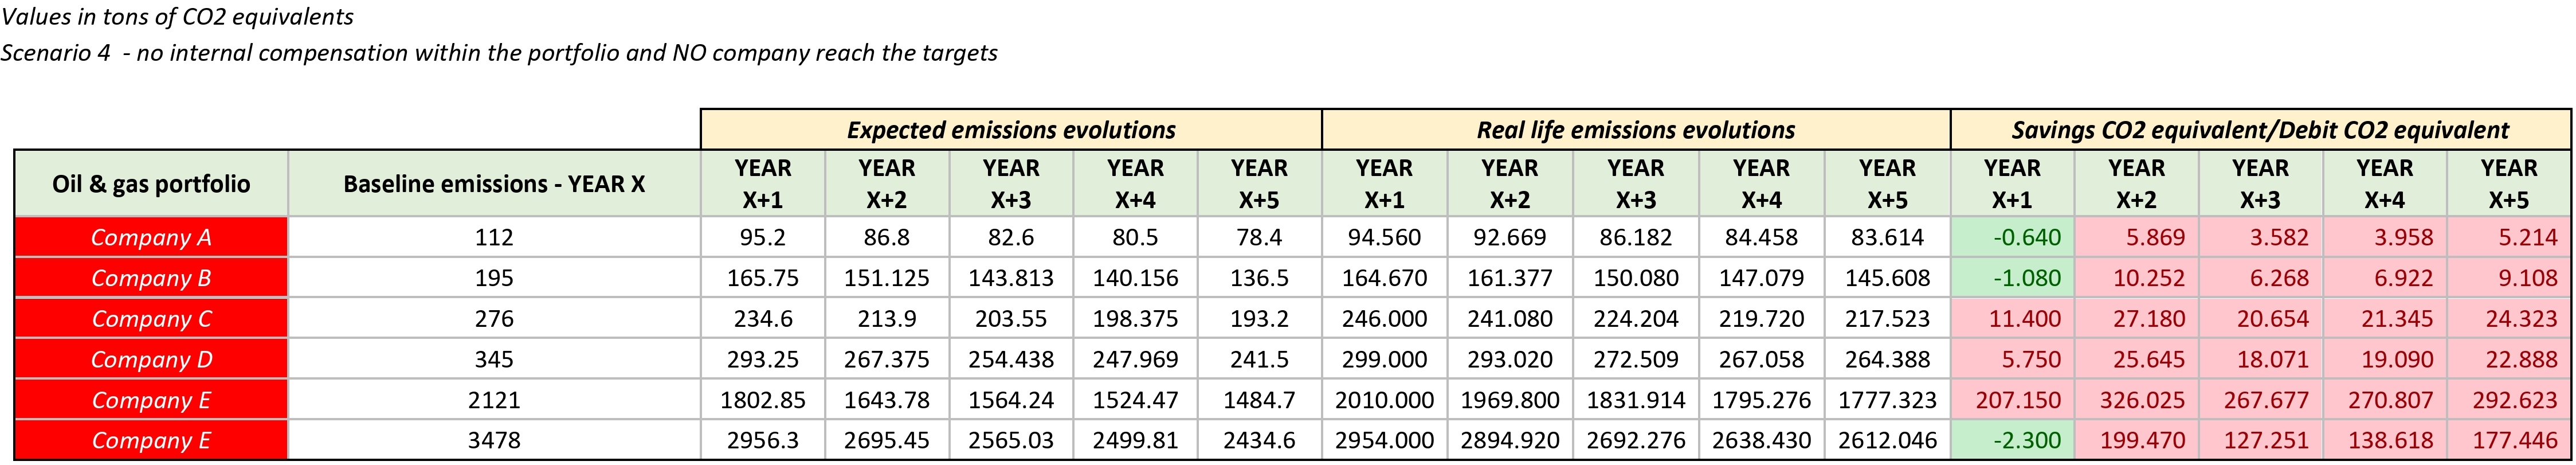
Scenario 4#
In this scenario, none of the companies within our portfolio reach the final target of a 30% reduction in emissions, and all fail to meet the yearly targets from year X+2 onwards.
In such a case, a detailed analysis is required for each company to determine:
Which companies should be put in run-off due to their inability to meet emission targets?
Which companies should be retained in the portfolio? This could be because they are strategically important, or they could potentially be financed with green financing, among other reasons.
Moreover, it becomes necessary to compensate for these CO2 debits with emissions savings from another portfolio, such as the power portfolio. This analysis should be conducted annually as soon as the yearly data are available. The focus should be on cherry-picking companies that:
Are on track to reach the Net Zero pathway.
Are the most profitable for the bank.
If they are not on track to reach the Net Zero pathway but are profitable and strategic for the bank’s portfolio, they should be financed with green financing to help them align with the Net Zero pathway.
This scenario highlights the need for an ongoing, dynamic approach to portfolio management, balancing environmental targets with financial and strategic considerations. It underscores the importance of adaptive strategies in achieving Net Zero goals while maintaining profitability.

Tokens for Net Zero Proposed Mechanics#
The proposed model for Net Zero banking is founded on several key principles:
Compensation of CO2 equivalent within and across portfolios, including intertemporal compensation.
Compensation of CO2 equivalent among companies within the same portfolio.
The use of tokens and tokenomics as central enablers for the efficient management and allocation of CO2 equivalent units.
Building Blocks of the New Model:
Maximising Revenues and Emission Reduction: This model aims to maximise revenues without exceeding CO2 equivalent targets, effectively eliminating the trade-off between emissions and profits.
Introduction of Tokens: Tokens represent CO2 equivalent units, facilitating efficient and value-driven transactions. These digital tokens are transferable within the bank’s organisational structures (e.g., from one portfolio to another) using internal transfer rates.
Central Organisational Structure: A centralised ‘CO2 Treasury’ manages the CO2 tokens, providing an effective system for reallocating savings from compliant companies to those that are not.
Tokens are digital representations of CO2 equivalent units and possess several characteristics:
Fungibility: Tokens are interchangeable, each having an equivalent value within the system.
Divisibility: Tokens can be divided into smaller units, enhancing liquidity.
Intrinsic Value: Tokens hold real value, making them valuable assets.
Tokenomics governs these tokens, ensuring sustainable supply, stability, and a robust carbon credit ecosystem. The value of these tokens may fluctuate based on various factors and can be transferred with specific penalties or weighting schemes to maximise effectiveness.
Central organisational structure ‘CO2 Treasury’ can play a crucial role in this model, managing the distribution and movement of CO2 equivalent tokens among portfolios and over time. This centralised system ensures efficient allocation and utilisation, avoiding moral hazards among Relationship Managers.
Utilising blockchain technology can significantly enhance the transparency, security, and efficiency of these transactions. Blockchain provides an immutable ledger that ensures the integrity of token movements, fostering trust among stakeholders. The ‘CO2 Treasury’ issues these tokens when baselines are established and is the sole official issuer of CO2 tokens within the bank. It is the only organisational structure authorised to move them among bank portfolios. The responsibility for intertemporal movements within the same portfolio lies with the Portfolio Manager.
Conclusion#
In summary, the proposed token-based Net Zero banking model represents a significant shift in the industry. By adopting tokens, banks can more effectively navigate the complexities of emissions reductions. This model’s key components include maximising revenues, introducing tokens, implementing a central organisational structure, and integrating blockchain technology.
The key findings highlight areas for improvement in As-Is Net Zero mechanics, suggesting a shift in focus to the NACE of loans rather than companies, and assessing loans based on their impact on the bank’s balance sheet. Efficient carbon credit management can be achieved through a token-based model that manages CO2 equivalent units effectively, aiding in meeting emissions targets while maximising business opportunities. Furthermore, Blockchain Integration enhances the transparency and security of CO2 token transactions, fostering trust among stakeholders.
Future research on the token-based Net Zero banking model should focus on two key areas: the effectiveness of transferring CO2 equivalent tokens within the banking system, particularly considering penalties and valuation over time, and the impact of this model on banks’ business models, risk management, and client relationships. This exploration is crucial for advancing a sustainable and financially viable approach in the banking sector.
References#
- Eur10
Europa. List of nace codes. European Commission, 2010. URL: https://ec.europa.eu/competition/mergers/cases/index/nace_all.html.
- eur23
europa. Glossary:carbon dioxide equivalent. europa, 2023. URL: https://ec.europa.eu/eurostat/statistics-explained/index.php?title=Glossary:Carbon_dioxide_equivalent.
- Man22
Open Risk Manual. Enterprise value including cash. openriskmanual, 2022. URL: https://www.openriskmanual.org/wiki/Enterprise_Value_Including_Cash#:~:text=Definition%20Enterprise%20Value%20Including%20Cash%20(EVIC)%20is%20the,book%20values%20of%20total%20debt%20and%20minorities'%20interests.
- nat23
nationalgrid. What are scope 1, 2 and 3 carbon emissions? nationalgrid, 2023. URL: https://www.nationalgrid.com/stories/energy-explained/what-are-scope-1-2-3-carbon-emissions.
- SA22
Crédit Agricole S.A. Crédit agricole s.a. details its intermediary targets and action plans to reach carbon neutrality by 2050 on 5 sectors. Crédit Agricole S.A., 2022. URL: https://www.unicreditgroup.eu/en/esg-and-sustainability/net-zero.html.
- SA23(1,2)
Crédit Agricole S.A. Crédit agricole s.a. details its intermediary targets and action plans to reach carbon neutrality by 2050 on 5 sectors. Climate workshop, 2023. URL: https://www.credit-agricole.com/en/pdfPreview/196180.
- San23
Intensa Sanpaolo. Strategy and net-zero. CLIMATE CHANGE, 2023. URL: https://group.intesasanpaolo.com/en/editorial-section/a-year-of-sustainability/targets-results-initiatives/climate-change/strategy-and-net-zero.
- une23
unepfi. Net-zero banking alliance industry-led, un-convened. unepfi, 2023. URL: https://www.unepfi.org/net-zero-banking/.
- Uni22a
UniCredit. Overview of key design choices. Oil&Gas, 2022. URL: https://www.unicreditgroup.eu/content/dam/unicreditgroup-eu/documents/en/sustainability/NetZero/Oil_and_Gas.pdf.
- Uni22b
UniCredit. Our path towards net zero. ESG and Sustainability, 2022. URL: https://www.unicreditgroup.eu/en/esg-and-sustainability/net-zero.html.
- Uni23
UniCredit. Our net zero targets. UniCredit, 2023. URL: https://www.unicreditgroup.eu/en/one-unicredit/articles/2023/february/our-net-zero-targets.html.